Van Heemstraweg 2A, Zaltbommel, The Netherlands

We analyse
mobility traffic movement cities

Platform and services to see and manage the bigger picture at one place

The world is urbanized

By 2040

65%

of the population lives in cities

80%

economy growth occur in cities

55%

growth in traffic levels

85%

rise of predicted congestion level

Our Services

Sustainable and innovative IT solutions for mobility

We cover the full operational cycle from data fusion to providing guidelines, scenarios and automation.

Data

We collect unique sources of data. From Floating Car Data to Telecom-data, AIS, CCTV, ANPR, Driver Experiences Apps, and more. 

Insights

We clean, process and transform the collected data with our algorithms to uncover patterns that really matters. Available through API, dashboards, and Apps

Data products

We valorize those data products  to reduce traffic congestion by analyzing behavior, detecting bottlenecks, distributing traffic load build-up and preempting gridlocks.

Cities and Municipalities

Reduce congestion, pollution and CO2 and increase safety and accessibility.

Transit Agencies and Operators

Offer convenient and sustainable mobility solutions.

Private
sector

Increase productivity and ease employee commutes.

Popular data products

Connect API

Get unified and direct access to open transport, mobility and geo data from government, commercial and crowd sources through API.

cameras

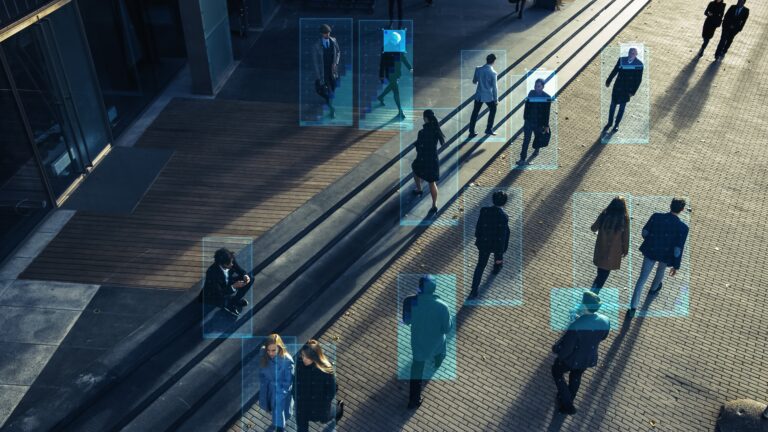
Use multiple cameras and image recognition AI to measure frequency, Origin-Destination, and behavior of people.

Tracking App

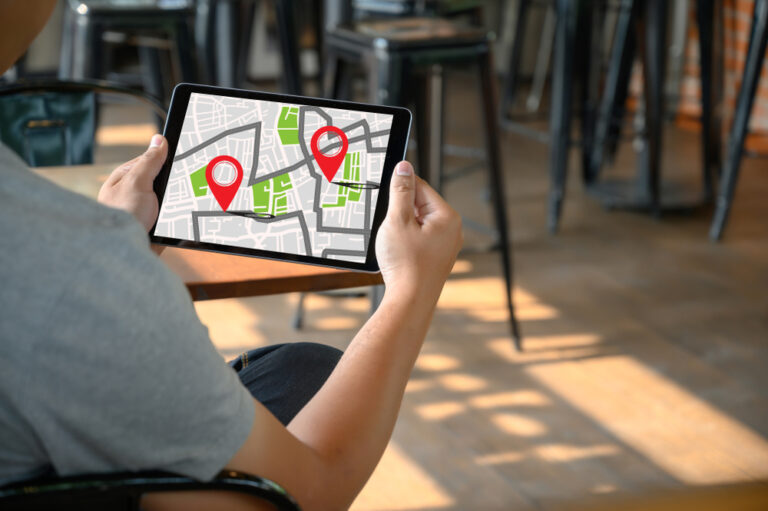
Connect a tracking App to measure the Origin-Destination, behavior, modality, and people flow.

Driving events

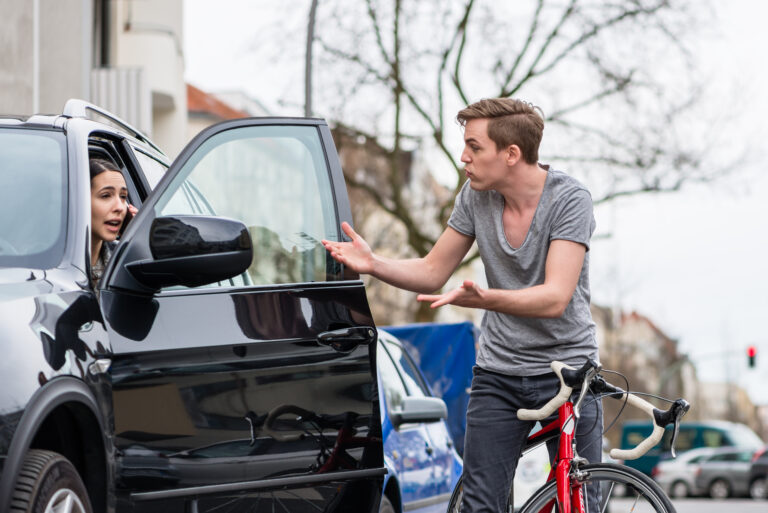
Detect, locate and count driving events; excessive speeding, risk zones, and more.

Social,Infrastructure,And,Communication,Technology,Concept.,Iot(internet,Of,Things).,Autonomous

Social Media

Combine social media with traveller movement behaviour.

Public

Transit Gaps

Uncover transit gaps and understand the impact of solutions through simulation.

Station

Public transport

Analyse first/last mile access to stations and and assess the impact of future transit changes on riders and local residents.

People,Rushing,In,The,Lobby.,Motion,Blur

Mobility scan

Measure the impact of different mobility policies on the commuting of employees. ​

Mobility scan

Use the Mobility scan to move mobility towards a sustainable, flexible and future-proof solution.

Gain insight into costs, multimodality, travel times, parking spaces and CO2 of employees, shoppers, sportclub members and more.

Environment act

On 1 July 2022, the new Environment Act entered into force, requiring companies with more than 100 employees to contribute to a 25% CO2 reduction by 2030 compared to 2016 in work-related traffic (commuting and business).

Read more

CO2 Performance Ladder

The CO2 Performance Ladder is an instrument that helps organisations reduce their carbon emissions in the organisation, in projects and in the business sector. With a certificate on the Ladder, organisations can receive an award advantage for their registration on tenders. The instrument is used as both a CO2 management system as well as a procurement tool.

Read more

Influencing driver behaviour
A4 - Corridor (NL)

Platform and services helping influencing the choice of drivers taking the main lane or the corridor and allowing smooth lane changes. Influencing between the lanes within the lane, and change lanes at the correct spot. For example, lane changes can be optimised, capacity can be optimally utilized and braking movements can be reduced just before the lanes split, which benefits traffic flow.

Road work (NL)

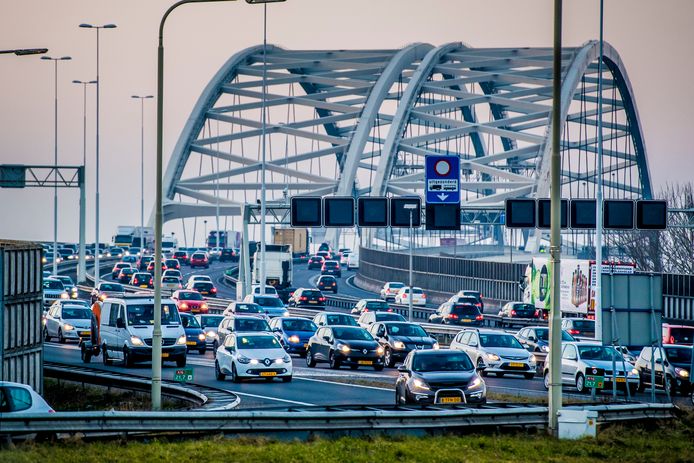
Combine GPS, floating car data and loop detector data to measure the impact of roadwork on traffic flow and provide guidelines for traffic plan automation.

Driving behavior (NL)

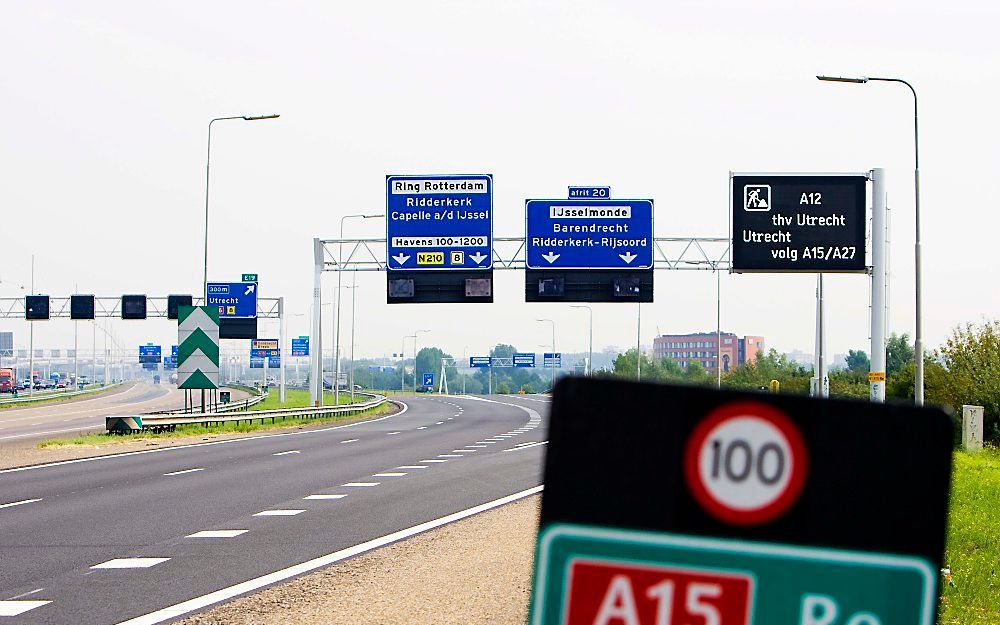
Experiment with a combination of GPS data, floating car data from in-car-navigation, loop detector data and matrix signs to understand how to influence traveller driving behavior.

Lane advice (NL)

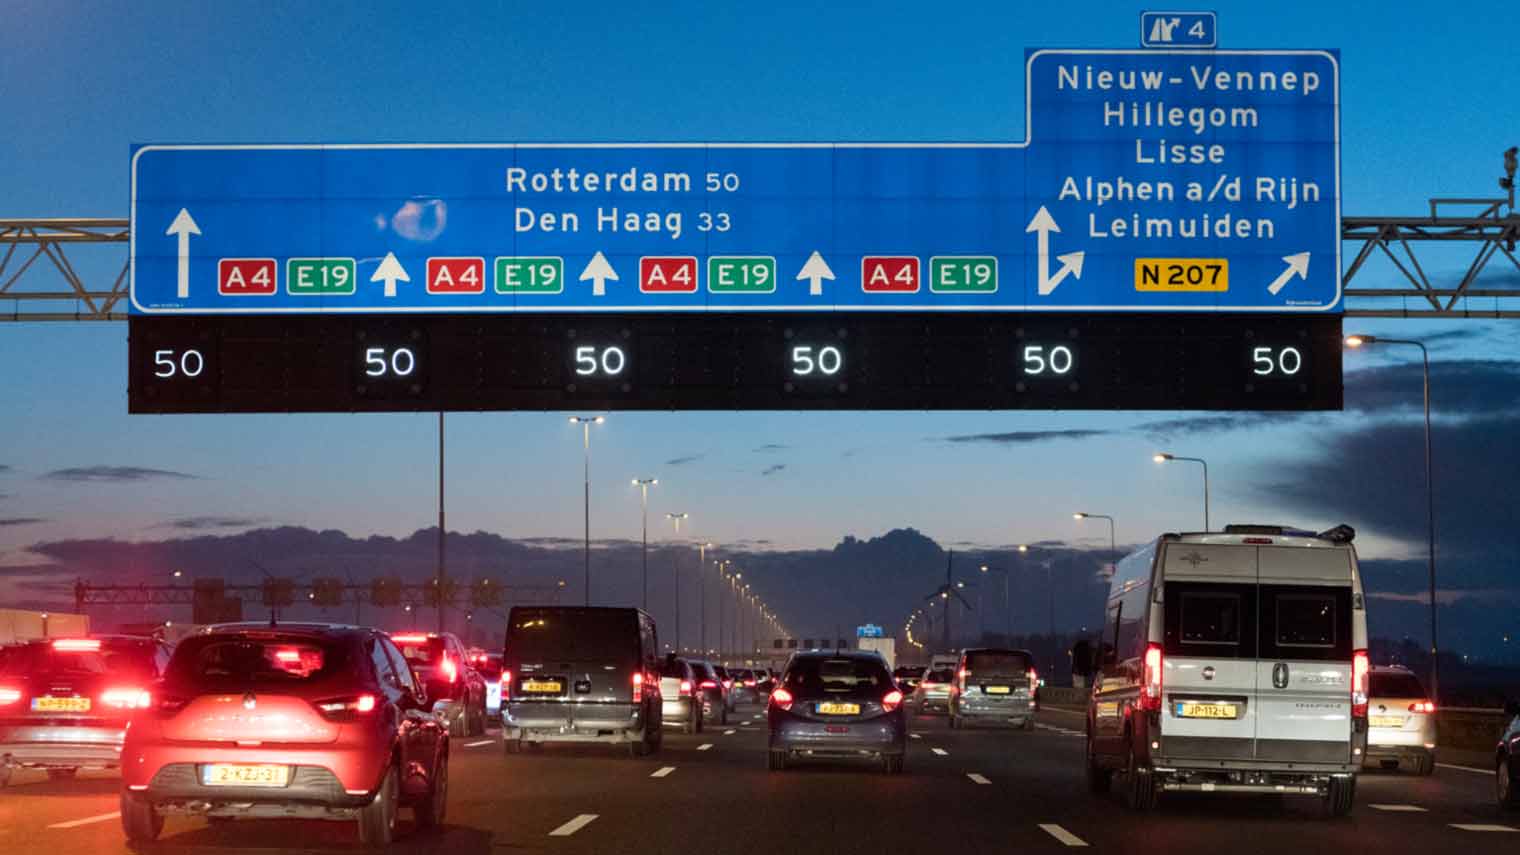
Combine different non matching floating car datasets, loop detector data and matrix signs to measure traveller follow-up behavior for automated lane-level advises.

en_US

Join Our Newsletter

Receive our latest blog posts directly in your inbox!